

Digital Asset Research & Strategy at MarketVector. Author: "Mastering Crypto Assets" Tweets/views are my own and not necessarily MV.
Frankfurt am Main, Deutschland
Joined August 2011
- Tweets3.9K
- Following591
- Followers1.6K
- Likes605


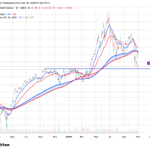



Bitcoin is back at its 200-day moving average. We’ve seen this setup before.
In November 2022, BTC bottomed after FTX. It rallied about 58% in 91 days, then pulled back about 19% to the 200-day SMA in March 2023.
In 2026, BTC bottomed on 30 June and rallied about 48% in 83 days. It is now about 14% off that high and sits 1.4% above its 200-day SMA, 134 days after the low.
Two things stand out in the overlay:
The structure is close: low, sharp rally, pullback, a test of the 200-day SMA.
The pace is not. The 2023 pullback took 18 days. This one has taken 51 and is shallower so far.
It also isn’t the same backdrop. The 2022 low came with BTC about 77% below its high, and the 2026 low came with it about 53% below. The March 2023 bounce coincided with banking-sector stress and shifting Fed liquidity expectations.
The useful part of an analogy is where it breaks. The 200-day SMA is at roughly $73K. A sustained close below it would mean this cycle is no longer following the 2023 script.
Source: MarketVector, daily BBR closing prices through 11 Nov 2026.

2
236
MarketVector Proprietary Model Alert: Nasdaq-100 (QQQ) Capitulation Signal Triggered
Following last Thursday’s extreme volatility expansion—where the Nasdaq-100 (QQQ) experienced a top-decile single-session drawdown and implied volatility (VXN) surged +52.6%—our proprietary MarketVector Fear-Reversion Model officially triggered a Capitulation Signal at yesterday's close (Nov 9, 2026).
Key Analytical Takeaways
The Volatility Reset: Following the initial panic peak, implied volatility experienced a sharp -24.3% two-day compression as derivative markets absorbed liquidity and institutional put-hedging pressures normalized.
Price Confirmation: QQQ rebounded +3.54% to $679.35, successfully re-engaging its long-term moving average filter.
Historical Backtest Context (2001–2026): Across nearly 7,000 trading days, our regime-adaptive model has identified only 7 prior Capitulation Signals under similar conditions. Historically, these signals have exhibited strong positive forward drift (86% 60-day and 90-day win rates, with a 100% win rate across all horizons since 2009).
Execution & Risk Management: Quantitative analysis of historical price paths indicates an initial post-signal consolidation window (averaging a mild ~3% pullback over the first 5 trading days) as institutional portfolios complete rebalancing. Consequently, systematic allocation frameworks favor staggered execution rather than concentrated lump-sum deployment on Day 1.
Source: MarketVector, CBOE, BATS (Daily Data: 2001–Nov 9, 2026). For institutional research and educational purposes only; this does not constitute investment advice, a recommendation, or an offer to buy or sell any security or financial instrument.
#MarketVector #QuantitativeResearch #Nasdaq100 #QQQ #Volatility #AssetAllocation #RiskManagement

1
165
Semiconductors had their second-worst day since 2000. History suggests resilience.
On Nov 5, the MVIS® US Listed Semiconductor 25 Index (MVSMH) fell 11.57%. Only March 16, 2020 (−15.70%) was worse. The next day it rebounded 4.01%.
What 26 years of daily data show:
After each of the six earlier episodes with a −9% day, the index was higher 21 trading days later. Three of the six were also higher after 63 days, including gains of 26%–32% in 2001, 2002 and 2020.
Extreme days are rare: 33 of 6,650 sessions, about 0.5%. They also cluster, so volatility tends to stay elevated for a while before it settles.
💪 Even after the pullback, the index is up roughly 29% year to date (total return), following a strong run to its June peak.
Outcomes have varied widely, and the sample is small. But the long record shows that sharp air pockets in this sector have often been followed by recovery, not just further declines.
Full chart below. 👇

1
168
Wall Street has a classic adage: “Markets love gridlock.”
With overnight projections pointing toward a divided government in Washington, election uncertainty is finally lifting. Consensus had heavily pre-discounted political headwinds across equities and, to a degree, digital assets. Here is what gridlock means for capital allocation, where the risk-reward looks best, and how Bitcoin fits in (chart below).
1. Why Gridlock is Bullish for Risk Assets
Regulatory & Tax Ceilings: Divided government puts partisan legislative shocks on ice. Corporate tax hikes, sweeping mandates and punitive antitrust rollouts lose momentum.
Fiscal Drag Slows Deficit Expansion: Without single-party control, oversized spending packages stall, taking upward pressure off long-term yields and easing duration pressure across tech, credit and growth.
Policy Fog Clears: Markets dislike bad policy, but hate uncertainty more. Historically, the resolution of midterms triggers a cyclical rebound as sideline cash re-enters.
2. What Looks Attractively Priced?
An “Inverse Trump Bump” compressed multiples into the midterms in sectors now finding structural bottoms:
Defense & Aerospace: Bipartisan defense appropriations historically endure under split rule, yet primes trade at discounted multiples.
AI Infrastructure & Semiconductors: Fears of federal data center mandates or compute caps compressed valuations. With gridlock, big tech Capex remains unimpeded by top-down restrictions.
Financials & Regional Banks: Less appetite for draconian banking overhauls and a stabilizing yield curve put a floor under net interest margins and valuations.
3. What About Bitcoin & Crypto?
Crypto traded defensively into the vote, hovering near $77,000–$78,000:
The Midterm Pattern: In 2014, 2018 and 2022, Bitcoin sold off into Election Day, ending 51%, 28% and 42% below its six-month high. Twelve months later it was higher every time: +24%, +45% and +92% (average +54%). The path was bumpy: after the 2014 and 2018 votes, BTC first fell a further 45–51%.
2026 Is Milder So Far: The slump into this vote was only about 11% from the six-month high, so Bitcoin is less washed out than in prior cycles (though still ~38% below its Oct 2025 peak). Three cycles are a pattern to watch, not a forecast.
Legislative Standstill: A split Congress means continued friction for market-structure bills like the CLARITY Act, but it also blocks anti-crypto tax policy and oversight expansion. Net neutral to bullish.
Institutional Core: With spot ETFs embedded, Bitcoin trades less on committee assignments and more on global liquidity, Treasury issuance and the Fed’s rate path.
Bottom Line: When Washington is deadlocked, private sector fundamentals (earnings growth, capital efficiency, productivity) regain control of the narrative.
Source: MarketVector, Bitcoin Benchmark Rate daily close through 4 Nov 2026. Past performance is not indicative of future results.
@SASchoenfeld

1
217
-12.6% in one session. The worst day in Alphabet’s 22 years as a listed company.
I pulled the 1-day rate of change for GOOGL (5,586 sessions since 2004). Four things stood out:
It’s a first. The previous records (-11.6%) were 2008 and 2020, both macro crashes. This was one company, one earnings print.
It was an ~8σ move against trailing 60-day volatility. Fat tails aren’t a footnote.
11.7 of the 12.6 points happened in the overnight gap. The regular session added just -1.1%. The repricing happened where nobody could trade it.
The three biggest moves of 2026 were all earnings days: +10.0% (Apr), -7.1% (Jul), -12.6% (Oct). The other days averaged ~1.4%.
Now the headlines. EPS missed ($2.12 vs $3.02). Revenue (+25%) was roughly in line. Cloud more than doubled, with a ~$560bn backlog and a 36% margin. The market sold the other half of the story: Search growth slowing to 12%, AI Mode monetizing below classic search, free cash flow turning negative, and 2027 capex set to rise “significantly”.
Same ingredients as April, when the stock jumped ~10%. The question changed from “Is there demand?” to “When does it turn into cash?”
My takeaway: a 1D rate of change doesn’t measure news. It measures the distance between what was priced and what was revealed. And history is no guide on what comes next. U.S. midterm elections are on deck this afternoon, with results from the seven key battleground states coming in through the night, from 7:30–9pm ET. But some tech names are definitely in a capitulation zone.

1
1
179
Risk appetite is facing a major moment of truth.
The Offensive vs. Defensive ratio—(SPHB + MTUM) / (USMV + QUAL)—just sliced cleanly below its 200-day moving average and is now testing critical support around 1.28:
• High Beta & Momentum are seeing aggressive liquidation relative to Low Vol & Quality.
• The ~1.28 level marks the key breakout shelf from late 2025.
• A breakdown confirms a deeper macro rotation into capital preservation; a hold offers a classic retest bounce.
Bulls need this line in the sand to hold. 👀
@SASchoenfeld

1
2
140
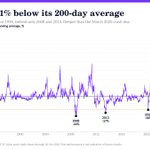
Silver closed Friday at $49.11, down 6% on the day. It’s now 31% below its 200-day moving average.
In 35 years of data, only two episodes were deeper: 2008 and 2013. March 2020 bottomed at -30%.

136

Martin Leinweber retweeted

@EricBalchunas joins us on our We Can Index That podcast, where he makes the case that the Bitcoin ETF was never the real story — debasement resistance and censorship resistance are. Watch the full conversation.
Watch: youtu.be/S9RXSX02QDI
Listen: open.spotify.com/episode/4Y7…
His book with @JSeyff: harriman-house.com/authors/e…
#Bitcoin #ETFs #DigitalAssets #IndexInvesting
Markets sold Brazil hard on Lula’s win. The record by president tells a more complicated story.
On Monday EWZ fell 19.8%, its second-worst day since 2000, as investors priced in the policy risk of a fourth Lula term. So we shaded 26 years of EWZ by presidential term.
Annualised EWZ total return (USD) by term:
Cardoso (from 2000): –27.0% p.a.
Lula I–II (2003–10): +36.6% p.a., a total gain of +1,110%
Rousseff: –14.4% p.a.
Temer: +14.0% p.a.
Bolsonaro (2019–22): –1.5% p.a.
Lula III: +11.0% p.a. That’s +86% through last Friday and +49% even after Monday.
Two things stand out.
First, the market-friendly candidate presided over a flat market, and the candidate markets fear has the best record on the chart.
Second, dividends matter a lot in Brazil. They turned Bolsonaro’s –27% price return into roughly breakeven, and they doubled Lula III’s annual return from 5% to 11%. Leaving out income gives a misleading picture of Brazilian equities.
That doesn’t mean presidents don’t matter. It means they matter less than the cycle they inherit: Lula I–II had the commodity boom, Rousseff had its end and a recession, and Bolsonaro had the Covid crash.
Elections cause the sharpest one-day moves, but commodities, the currency and fiscal credibility have set the long-run return. Monday priced in the politics. The cycle will decide what comes next.
@SASchoenfeld

1
189

Capitulation in South Korea’s $EWY.
The green diamond marks a major capitulation signal: our Equity Capitulation Index has crossed above 95 on a 0–100 scale and now stands at 97.9.
The indicator combines four equally weighted measures:
• How far price has fallen below its 50-day average.
• The seven-day decline relative to recent volatility.
• Drawdown from the highest close over 90 days.
• Oversold momentum measured by RSI.
A reading this high means several measures of downside stress are near their extremes simultaneously. It suggests selling may be approaching exhaustion, creating conditions for a potential rebound. The signal identifies the stress; price action still needs to confirm that buyers are returning.
After closing below its 200-day EMA, $EWY is back around that level in premarket trading. That makes this an interesting test: holding above it would be an encouraging first sign of stabilization.
@MarketVector @SASchoenfeld

2
335
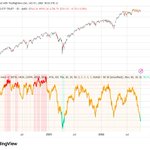
Our US Equity Heat Index is at 18.6, which is capitulation territory, yet SPY sits just 2% below its all-time high.
Since 2007, only 13% of sub-20 Heat days came with SPY this close to its highs. In 3 of those 4 episodes (Dec 2007, mid-2015, Dec 2015), a 10%+ drawdown followed within six months.
The breadth under the index is weakening.

5
176

What is the outlook for #Ethereum based on a power law?
Our MarketVector Ethereum Valuation Corridor maps ETH's long-term growth against its network age, from launch in 2015 to today.
Where we are (24 Sep 2026):
• ETH: ~$2,690
• Floor: ~$1,700 (+58% above)
• Fair value: ~$3,840 (30% below)
• Ceiling: ~$9,460
ETH sits in the lower 27% of its corridor, below fair value but not in the cheap zone.
The floor has been a solid guide. The 2018 low ($84) and the 2022 low (~$1,060) both held above it. This cycle's low (~$1,580) only briefly touched it.
What the model implies for end of 2029:
• Floor: ~$3,300
• Fair value: ~$6,850
• Ceiling: ~$14,000
ETH has grown on a flatter curve than Bitcoin. ETH/BTC stands at 0.032, 77% below its 2017 peak.
As we enter the era of tokenization, stablecoins and AI agents, ETH's underperformance against BTC should come to an end.
@MarketVector @SASchoenfeld

2
169
#Bitcoin is completely breaking script this cycle.
Historically, midterm years (2014, 2018, 2022) brought brutal Q3/Q4 bleed-outs down toward the 30–40 range.
2026 is doing the exact opposite, decoupling from the historical median and pushing back toward the highs.

1
162
As extreme #Bitcoin price targets make the rounds again, a quantitative perspective matters.
We built the MarketVector Bitcoin Valuation Corridor: a power-law model of BTC's price against time, fitted on weekly data since 2010. It gives three levels: a floor, a fair value and a ceiling.
Where we are today (24 Sep 2026):
• BTC: ~$84.5k
• Floor: ~$69k (+22% above)
• Fair value: ~$134k (37% below)
• Ceiling: ~$308k
BTC sits in the lower 13% of its long-term corridor, about 0.7 standard deviations below trend. Historically, that has been closer to value than to euphoria.
The floor has been a reliable guide. Cycle lows in 2015, 2018 and 2022 held at or above it. This cycle's low (~$60k) dipped only briefly below it before recovering.
What the model implies for end of 2029:
• Floor: ~$188k
• Fair value: ~$360k
• Ceiling: ~$677k
One more takeaway: the ceiling is rising more slowly than fair value. Each cycle's peaks have been less extreme than the last, a sign of an asset that is maturing.
@MarketVector @SASchoenfeld

MVTT10F — the MarketVector Token Terminal Fundamental 10 — doesn't rank crypto assets by market cap like everything else out there. It ranks them by what they actually earn: protocol fees and active usage, pulled directly from Token Terminal's data every month.
The result, so far in 2026:
MVTT10F: +32.6% YTD
MarketVector Digital Assets 100 Equal Weight: -7.2%
Bitcoin: -2.0%
While most of the market ground sideways or lower, the ten assets actually generating cash flow pulled away.
That's the whole thesis in one chart.
The other chart is the "who's in it" answer. Ten names, rebalanced monthly, weighted by fundamentals:
TRON 21.1% · Uniswap 18.3% · Hyperliquid 10.4% · Solana 9.7% · BNB Chain 9.6% · Aave 7.2% · Pump.fun 7.0% · Morpho 6.3% · Ethereum 5.6% · Bitcoin 4.7%
No long tail of zero-revenue tokens diluting the exposure. Just the assets monetizing their networks.
Full methodology and daily levels: marketvector.com/indexes/dig…
@tokenterminal


Martin Leinweber retweeted
In @Forbes_MENA_, @mleinweber2 told Joyce Abaño that #Bitcoin's rally past $86,000 followed two resolved #crypto risks, the Fed hike and the CLARITY Act's Senate failure. "The market rallied anyway," he noted. forbesmiddleeast.com/money/c…
