


Pinned Tweet
"Traders have an expression to describe how unpredictable financial markets can be: “better off dumb”.
economist.com/finance-and-ec…
#quote
2
2
1,396


The end of ‘The Magnificent 7’: the problem with stock nicknames ft.com/content/2ac61eb8-8d28…
657
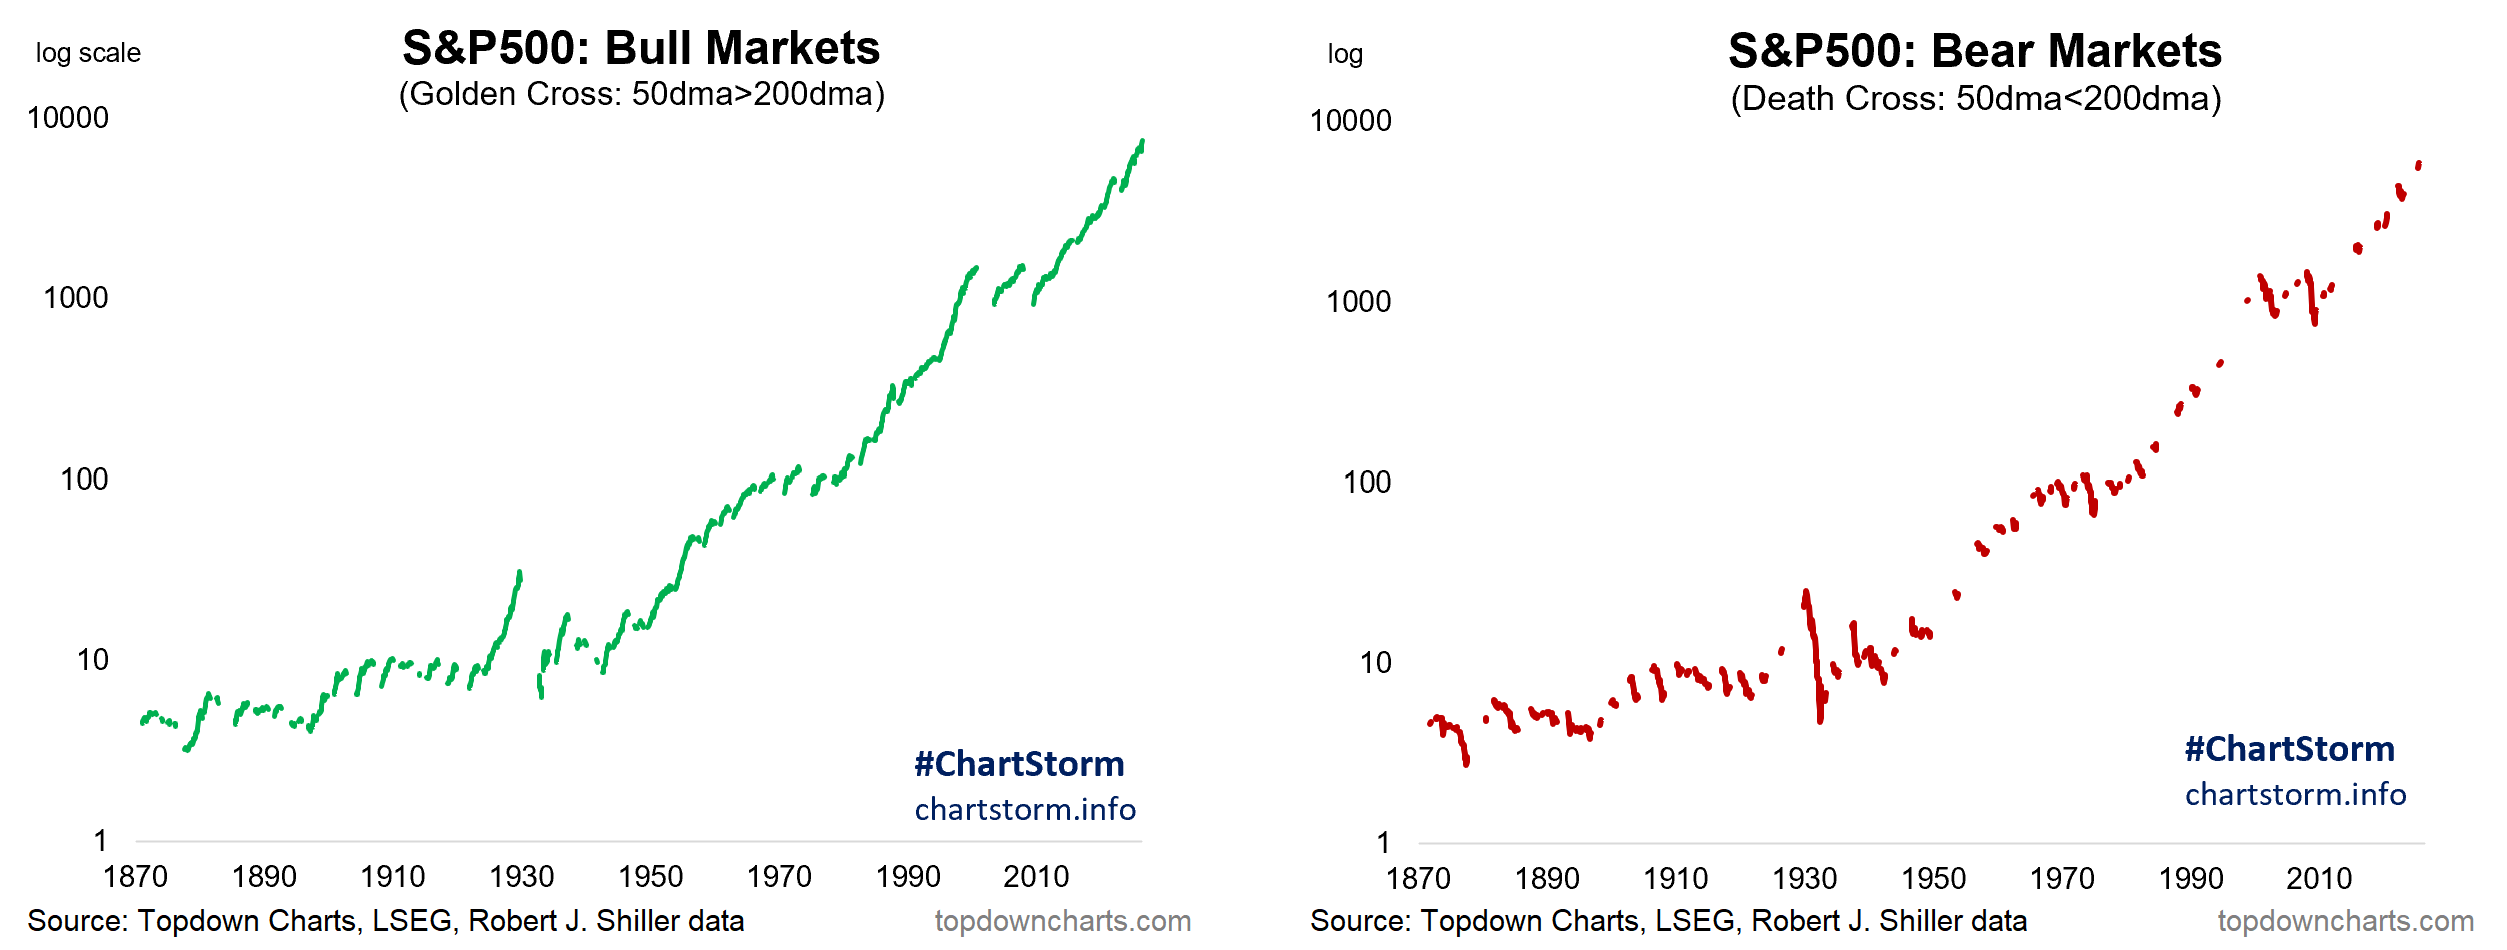
The S&P 500 during Bull Markets & Bear Markets nitter.cf/spxindex/status/206861…

1
298
A History of Stock Market Percentage Declines In Charts (15% to 50%+) tradethatswing.com/a-history…


A History of Stock Market Percentage Declines In Charts (15% to 50%+)
tradethatswing.com/a-history…
There are loads of 15% and smaller declines. When a decline starts, inevitably, many claim it will turn into the next great crash. Yet even 30% declines are very rare.
Here's the data, in charts, back to 1871.

322
How Often Does a 5% Pullback Turn Into a Correction or Bear Market?


Yes, this recent bout of volatility hasn't been fun for investors, but remember, volatility is the toll we pay to invest.
These three charts are timeless and always come in handy in times like this.
Chart 1 - The average years sees more than three separate 5% mild pullbacks a year and one 10% correction on average a year. This is our first 5% mild pullback since November, it happens.
Chart 2 - Peak-to-trough the S&P 500 corrects 14.1% on average since 1980. Looking closer at those past 46 years, 24 of them saw a 10% correction and incredibly 14 of those years still finished higher.
Chart 3 - We are in a mild correction, but how often do things get worse? 24.8% of the time stocks move into a correction and only 12.4% do they move into a bear market.


200
"Markets correct through price or time!"


Markets correct through price or time!
In this case, a lot of the work had already been done through time, with strong earnings growth bringing valuations down even before the Middle East conflict.
The recent selloff has just accelerated that — but most people are still focused on the relatively small price drop from the highs.
(Link in reply to read more)

183


spxindex.com retweeted

At least for now, the US stock market is rebalancing in one of the best ways possible. The mega caps seem to be taking a rest while the rest of the market breaks out. For now, the broadening is not a zero sum game.


When at least 6 S&P 500 sectors trade above their 200-day moving average, forward returns for $SPY have historically been stronger. Today, all 8 major S&P 500 sectors are above their 200DMA. A sign of broad market participation.

ALT Chart showing the S&P 500 alongside sector breadth, measuring how many major S&P 500 sectors are trading above their 200-day moving average. The current reading shows all 8 sectors above their 200DMA, indicating broad-based market strength. © Bluekurtic Market Insights
1
253
Beat the Market: An Effective Intraday Momentum Strategy for S&P500 ETF (SPY) (2025) dx.doi.org/10.2139/ssrn.4824…
1
235
"Year to date, the S&P 500 has logged 24 up days of at least 1% and 23 down days of at least -1%."
kill-the-newsletter.com/feed…

1
200
Best Trading Indicator To Build A Strategy Upon—200-day Moving Average & 10-month Moving Average youtube.com/watch?v=aenu7yUx…
Meb Faber: A Quantitative Approach to Tactical Asset Allocation (2013) web.archive.org/web/20181010…
Faber Tactical Asset Allocation (2025) extradash.com/en/strategies/…
2
1
234
Achieve Consistent Profits: Harness the Power of the 10/20 EMA Crossover - Eliminate Drawdown! youtube.com/watch?v=cGd2FPyh…
1
143
Best Trading Indicator To Build A Strategy Upon (200-day Moving Average & 10-month Moving Average) youtube.com/watch?v=aenu7yUx…
Meb Faber: A Quantitative Approach to Tactical Asset Allocation (2013) web.archive.org/web/20181010…
2
1
190


Meb Faber: Where the Black Swans Hide & the 10 Best Days Myth (2011) web.archive.org/web/20210914…
1
134
When the Fed Cuts: Lessons from Past Cycles for Investors blogs.cfainstitute.org/inves…
1
157
S&P 500 Returns in 2025 Have Been a Story of Profitability carsongroup.com/insights/blo…
148