

Head of Investments | Pictet Asset Management Japan | 'Lag in Effect' of Global Liquidity | LSE PhD Alum
Tokyo
Joined July 2019
- Tweets674
- Following295
- Followers10.6K
- Likes497



Pinned Tweet
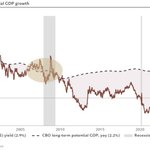
The US is currently exhibiting classic mid-cycle dynamics.
It's noteworthy that current conditions almost exactly mirror 1997 when the Greenspan Fed enacted a single tap-on-the-brakes rate hike.


Warsh: “While overall financial conditions are tighter, I'm unwilling and unable to call them tight.”
Getting close. All else equal, 2 more hikes would get Fed Financial Conditions Index net tight.

Steve Donzé retweeted

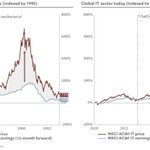
Unlike the dot-com bubble, when global technology stocks surged far ahead of earnings, the current rally has been supported by stronger earnings growth.
Source: @steve_donze

Steve Donzé retweeted

There are a lot of bears likening the current market environment to the Dot.com bubble. There are certainly some similarities, but there are vastly important differences as well. In the late 90s, global technology stocks surged far ahead of earnings, the current rally has been supported by stronger earnings, revenue and profit growth.
@steve_donze @bcaresearch


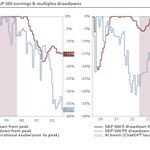
Some thoughts shared with FT @harrydemps on latest AI jitters.
ft.com/content/cf5f1209-da29…

Outside rate-insensitive borrowing (public deficit, AI buildout), the most vulnerable sectors (housing) bear the full brunt of tightening.

Counter-intuitively, the US aggregate corporate borrowing cycle is still in its early stages.
Why? The AI buildout first relied on internal finance. And the non-AI corporate sector is largely crowded out.


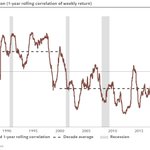
Put it differently, the diversifying negative equity/bond correlation in 2000s/2010s was a departure from prior and current decades.


Positive SPX–10Yr Yield correlation has prevailed near 4%–5% . . . . . . but relationship has typically been negative at 10Yr Yields well above 5%
This is a trajectory plot of the rolling correlation between S&P 500 moves and 10-year Treasury yield moves, shown against the level of the 10-year yield itself, from June 1985 to 25 September 2026. The path traces how the stock–yield relationship has changed as the yield level has changed.
Positive correlation means stocks and yields have been moving in the same direction (a growth or “good news is good news” regime). Negative correlation means they have been moving opposite each other (rising yields acting as a valuation or tightening headwind, or falling yields supporting equities).
Two regimes stand out on the chart.
Around 4–5%, observations cluster in positive-correlation territory (roughly +0.4 to +0.9). That is the zone that has prevailed for much of the period since yields rose out of the post-GFC lows. Equities have often been able to advance even while the 10-year stayed elevated or moved higher.
Well above 5%—the large cloud stretching from about 5.5% to 11%—the correlation has typically been negative. That cloud is dominated by the 1980s–2000s, when a long decline in yields coincided with a long equity bull market. In that environment, falling yields and rising stocks produced negative co-movement.
The 25 September 2026 observation sits in the positive-correlation cluster, just left of the 5% line. That is consistent with the recent pattern FinTwit has been highlighting: near current yield levels the co-movement has still been positive.
The chart does not say yields above 5% automatically produce a rising S&P 500. It says the sign of the correlation has historically differed by yield zone. If the reading stays positive, modest further increases in the 10-year need not immediately cap equities.
A sustained flip into negative territory would mean rising yields had become a more direct headwind.
@chris_robb1 @fundstrat @robin_j_brooks @DannyDayan5 @AlanLongbon @CestrianInc @jfozak @steve_donze


A useful reminder that Treasury activism effectively impacts bond term premium, not all-in yield.


