

Gold charts & market data analyst. Lifelong obsession with charts. Searching all charts nautical & golden for that pot of gold.
DownUnder
Joined April 2025
- Tweets7.5K
- Following885
- Followers13.3K
- Likes314

Pinned Tweet
All these charts and 1000's more available on my website goldchartsrus.com for the price of a coffee. Over 75,000 charts on 8,500 pages dedicated to gold, precious metals & financial markets.
The website is old school built in php/html on notepad & an old XP box. It is not HTTPS but is entirely safe to use. It will never be updated nor replaced & you will find many charts here that you won't find anywhere else on the web. The website has been designed around online databases updated intraday/dailyweekly/monthly that allow all the 1000's of charts to update.
It shows one man's obsession with gold & historical data & the ability to write charts in code to show unique insights.
With so many charts to view you will find out why I perceive charts as golden conveyors of information.
A picture is worth a thousand words & a charts shows a lifetime of prices.


GoldFish Charts retweeted

Silver declined as far as it could make sense. Now let's see when the bounce comes...

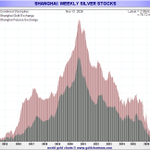
Shanghai Silver Stocks


🚨 Shanghai Gold Exchange (SGE) released their weekly numbers today:
↗️ Silver inventory up 20 metric tons last week
🈳 Total silver inventory: 827 metric tons (still low)
🔥 The low inventories and the high premium over the LBMA benchmark price, proves there is a glowing demand for physical silver in China.


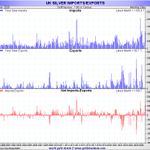
UK Silver Imports/Exports For September
The silver the US exported was sent to the UK & Switzerland & here you can see it ending back in London where it came from.
Imports = 1157 tonnes
Exports = 56 tonnes
Restocking....101....


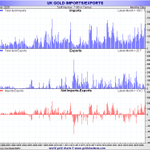
UK Gold Imports/Exports For September
The gold the US exported was sent to the UK & Switzerland & here you can see it ending back in London where it came from.
Imports = 200 tonnes
Exports = 25 tonnes
Restocking....101....


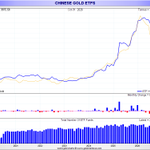
Chinese Gold ETFs For October
23 Gold ETFs hold 311.1 tonnes (10 m/oz) & added 6.3 tonnes in October.
Note the divergence this year with the gold price down & holdings up.

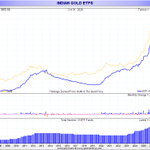
Indian Gold/Silver ETFs For October
26 Gold ETFs hold approx 142.6 tonnes (4.58 m/oz) adding 2.4 tonnes in October
19 Silver ETFs hold approx 3,986 tonnes (128 m/oz) removing 140 tonnes in October


5
729
GoldFish Charts retweeted

Remarkable. Gold now trades around $361bn a day on average, more than T-bills, euro/sterling or US 10-year Treasuries.
That's not a niche asset anymore.
It's one of the deepest markets in the world.
📊 @KobeissiLetter


Value Up as Trust Down



GoldFish Charts retweeted

Thanks! Yes, it's from my monthly Gold & Silver Flows report, built buy one of my grok bot that is screening all the declared gold import / export. Here's silver: the US was the biggest net seller in Jan–Aug 2026 (−4,550 t), while Greater China (+2,834 t) and India (+2,296 t) were the biggest buyers.


GoldFish Charts retweeted

CNY international payments on CIPS surge 22% Q/Q in 3q26, up to ¥61 trillion (~$9 trillion) in the quarter.
This outcome was predicted by Angell Paradox (h/t @Kathleen_Tyson_ ): The more the US weaponizes the USD system, the faster CNY payments rise.

Reset time is our time now for the next 5 years...

Gold has long been the base money 'de jour'.
When the world goes through a reset all assets above gold deflate in ascending order with gold the bedrock as it has been for eons.
These resets have been approx every 3 generations & always come into play as the hegemon's roll over.
We are in that process now.


