

Gold charts & market data analyst. Lifelong obsession with charts. Searching all charts nautical & golden for that pot of gold.
DownUnder
Joined April 2025
- Tweets7.5K
- Following885
- Followers13.3K
- Likes314

GoldFish Charts retweeted

Silver declined as far as it could make sense. Now let's see when the bounce comes...

GoldFish Charts retweeted

Remarkable. Gold now trades around $361bn a day on average, more than T-bills, euro/sterling or US 10-year Treasuries.
That's not a niche asset anymore.
It's one of the deepest markets in the world.
📊 @KobeissiLetter

GoldFish Charts retweeted

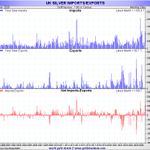
Thanks! Yes, it's from my monthly Gold & Silver Flows report, built buy one of my grok bot that is screening all the declared gold import / export. Here's silver: the US was the biggest net seller in Jan–Aug 2026 (−4,550 t), while Greater China (+2,834 t) and India (+2,296 t) were the biggest buyers.


GoldFish Charts retweeted

CNY international payments on CIPS surge 22% Q/Q in 3q26, up to ¥61 trillion (~$9 trillion) in the quarter.
This outcome was predicted by Angell Paradox (h/t @Kathleen_Tyson_ ): The more the US weaponizes the USD system, the faster CNY payments rise.

GoldFish Charts retweeted

Don Durrett sees gold reaching $8,000 an ounce within 36 months and expects silver to reach $200. He believes silver will trade at a minimum floor of 2% of the gold price or $160, once it is treated as a monetary metal, rendering industrial supply and demand secondary. As the Federal Reserve fails in its attempts to cut interest rates and print enough money to stabilize the economy, he expects a major influx of global institutional and retail capital into gold.
GoldFish Charts retweeted

I'm most concerned about the first quarter. Gold is falling and may reach a temporary low next week, the week of the 18th.
My concern is that the rebound would be driven by geopolitics.
GoldFish Charts retweeted

The American Dream used to be owning a house, raising a family, and retiring with dignity.
Now it's financing a refrigerator over 36 months with a buy now pay later product while a billionaire explains why inflation is actually good for you.
This is 2026.
GoldFish Charts retweeted

Luke Gromen on BNN Bloomberg to discuss
Gold as it hits its lowest price levels of 2026

GoldFish Charts retweeted

Just had a debate in HK with a charlatan who’s pushing the sheep into the Nvidia and the US AI Ponzi.
What a day, lol.
GoldFish Charts retweeted

Stu Thomson on Gold: "the potential upside for this rally could perhaps be described as one of the greatest in the history of the gold market." 🤔

GoldFish Charts retweeted

The sun's energy is free, but the moon's metal it takes to catch it is not.
Exchanges in London, New York and Shanghai gave up about 440 Moz of silver between 2020 and March 2026, almost 3x solar's 2026 demand.
COMEX alone is down about a quarter since January, per CME.

GoldFish Charts retweeted

Every secular precious metals bull market, including those of the 1970s and 2000s, has experienced one major correction along the way before surging much higher, and the 2026 correction is no different.
Learn more in my latest report:
thebubblebubble.substack.com…
$GLD $SLV

ALT Every secular precious metals bull market, including those of the 1970s and 2000s, has experienced one major correction along the way before surging to much higher prices, and the 2026 correction is no different.
GoldFish Charts retweeted

As Singapore gains increased custody status, consider the different strategic benefits:
China. Strengthens its sovereignty & ability to utilize its gold.
HK. can increase its RMB & dollar funding role
London can preserve role in trading, liquidity & standards - even while some vaulting moves elsewhere. Gold trading demand rises.
US - can gain if dollar funding role grows.
This provides a chain of events where
1. China accumulates gold.
2. Key Asian centres expand custody & clearing
3. London & int banks provide financing
4. Gold becomes more financially useful
5. Dollar funding may even grow.
That offers a so-called Nash equilibrium for all players in the game.
"The best result comes from everyone in the group doing what is best for themselves & the group."
Interesting.

You have 3 very interesting developments unfolding in the global gold market:
Singapore:
Its central bank has launched a service to store gold for foreign central banks, with a capacity of 500 tonnes.
China:
Beijing is courting foreign central banks to buy and store gold in China through the Shanghai Gold Exchange.
Hong Kong:
Authorities are seeking participation from foreign central banks in a new gold-clearing system, while aiming to expand gold storage capacity to over 2,000 tonnes.
Watch this closely...
A scramble is playing out.

GoldFish Charts retweeted

The world has definitively split into East and West.
BRICS and G7. The wheat and the chaff.
Who does the future belong to?
The answer is becoming impossible to ignore.
GoldFish Charts retweeted
Gold's massive 10-month formation in play. A consolidation that could take gold to $10k upon successful breakout.
Note that the initial false August breakout already done. Next should come the real breakout. Gold is trading around the apex of the formation, hence, resolution should come before year end 2026...

GoldFish Charts retweeted

BREAKING: Global central banks bought +321 tonnes of gold in Q3 2026, their largest quarterly purchase since Q4 2024.
This also marks their 5th-largest quarterly purchase on record.
Central bank gold purchases were up +8% from +296 tonnes acquired in Q2 2026 and up +453% from Q1 2026.
By comparison, the 5-year quarterly average stands at +227 tonnes.
China and Poland led Q3 demand, adding +63 tonnes and +40 tonnes, respectively.
Year-to-date, global central banks have purchased +675 tonnes of gold, up +6% from the same period in 2025.
Central banks are aggressively buying the dip in gold.

GoldFish Charts retweeted

Historical Gold-to-Silver Ratio chart (1687–2025)
The ratio remained relatively stable for centuries under monetary systems that often fixed or influenced the relationship between the two metals.
Since the transition to freely floating precious metals prices, it has experienced extraordinary swings. The historical annual average from 1687–2025 is approximately 29:1, compared with roughly 60:1 since 1971.
In January 1980, the ratio briefly fell toward 17:1.
During the extraordinary silver rally of April 2011, it declined toward 31:1.
These were not identical market conditions, and there is no guarantee that those extremes will recur.
But they illustrate how dramatically silver’s purchasing power relative to gold can change.
Full Research link below 🔗
