

Senior Equity Analyst at ByteTree | CFA Charterholder | Focused on quality investing | Views my own, not investment advice.
London, England
Joined March 2019
- Tweets4.8K
- Following502
- Followers1.2K
- Likes8.3K







Pinned Tweet
“A great business at a fair price is superior to a fair business at a great price… The investment game always involves considering both quality and price, and the trick is to get more quality than you pay for in price. It’s just that simple." - Charlie Munger
@ByteTree Quality is an investment research service which does exactly that.
#Quality #Investing
bytetree.com/bytetree-qualit…

Incredible day, incredible data from @bytetrend.

The bytetrend.io platform offers an MCP that allows you to interrogate 20 years of trend data on 4,000 stocks, plus ETFs, commodities, and crypto.
This allows you to plug it into an LLM of your choice, and interrogate the data with natural language.
Given the incredible moves today (Nasdaq $QQQ most notably), I asked it to investigate similar episodes from the past and share the strongest conclusions.
What history says:
These days are rare and come in clusters. There have been 50 days of -4% or worse since 2005, about 1 in 110 sessions, and 34 of them fell in 2008, 2020 and 2022. After any -4% day, another followed within a month 64% of the time; on an ordinary day that chance is 10%.
There’s no reliable bounce. The next day was up 29 times out of 50, with a median of +0.3%, much like a normal day (55% up). On the first -4% day of a selloff, the next day was up only 5 times in 11.
The headline 12-month return is flattered by 2008 and 2020. Across all 50 days the median 12-month return is +33.5%, against +19.4% for all days. Drops that started within 10% of the high, as today’s did, give +20.8%. That’s an ordinary year, not a buy-the-crash payoff.
Only two near-high drops failed. Of 14 with a full year of data, 12 were higher a year later. The exceptions were 4 January 2008 (−36%) and 3 February 2022 (−14%), both the start of bear markets. In 2022 Weekly Local was already 3 going in.
Weekly Local separated the good cases from the bad. On all 9 days the Nasdaq fell 4% with Weekly Local at 5 the day before, it was higher 12 months later (median +44%). Those 9 days make up six separate episodes, so it’s a small sample. The low usually wasn’t in yet: four of the six episodes closed lower within three months, by up to 16% (October 2018) and 18% (February 2020). In the recoveries Weekly Local bottomed at 2. In 2022 it fell to 1, and in 2008 to 0.
What’s new this time is weaker leadership against the world. In all nine of those cases Weekly CAPR was also 5. Today it’s 3, and the Nasdaq’s CAPR is 5.4% below its 3 June peak, two days before the June drop. No -4% day in the dataset has had Weekly Local 5 with Weekly CAPR at 3 or less. The nearest cases are Brexit day 2016 (+36% a year later), February 2022 (−14%) and April 2025 (+31%).
High beta works both ways. After 48 of 49 -4% days, the Nasdaq beat MSCI World over the next 12 months; the exception was February 2022. On an ordinary day that happens 84% of the time.
Breadth was already soft. Across the 4,093 ByteTrend stocks, the share of Weekly Local 5s yesterday was 27.5%. That’s in the bottom fifth of readings since 2010, where the median is 39%. Before the harmless shocks of 2016 and February 2018 it was 41–44%. Today’s level is closer to August 2011, February 2022 and April 2025, which had mixed outcomes.
Hedges have worked less well since 2021. On these days $GLD (SPDR Gold Shares) rose half the time overall but only 3 times in 12 since 2021, and it fell 3.7% on 5 June. $TLT (iShares 20+ Year Treasury Bond) rose 71% of the time overall and half the time since 2021. $XLP (Consumer Staples Select Sector SPDR) rose 6 times in 45, and bitcoin 10 times in 30.
@ByteTree @AtlasPulse @WinderKit

Kind of hard to take your eyes off it.
So many huge moves today.
Reddit $RDDT -30.6%
Intel $INTC -30.6%
Twilio $TWLO -16.1%
Sandisk $SNDK -15.1%
Coherent $COHR -13.4%
Datadog $DDOG -12.5%
Dell $DELL -12.5%
Nasdaq $QQQ has barely offered the slightest flicker of resistance all day, now -4.1%, and Tech $XLK -6%.
Shout out to FedEx Freight $FDXF and Regeneron $REGN for putting in double digit gains on such a day.


Sad to miss the moment when a 20.77% gain in the $VIX took its value to 20.77.
Quite the move today.


An old-school throwback of a day.
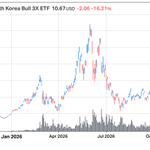
A $KORU -16% kind of day.
Except this time, it's not taking a breadth after making new highs. It's threatening new lows, 70% into an existing drawdown.

Kit Winder, CFA retweeted

Short monthly update for clients:
bytetree.com/research/2026/1…


As $QQQ falls another 2.5% pre market, led by the likes of Intel $INTC and Amazon $AMZN, capital is flooding back into cheaply valued, unloved, high quality defensive stocks.
Many are in consumer staples. Healthcare is also benefitting. Software has staged a dramatic comeback. At ByteTree Quality, these are the areas we are focused on.

October was a good month for the ByteTree Quality portfolio.
"This chart shows the change in each sector’s trend over the past month, with a higher score being better. We own insurance stocks but no banks, and no tech, materials, or industrial stocks, which fell back in October. Consumer Defensives have been the biggest winners in this rotation, and they are our largest position."

Caterpillar $CAT - another one.
-9% yesterday.
How many times will we see something like this?
Excellent company? Yes.
AI beneficiary? Yes.
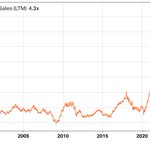
But it spent 25 years in a sales multiple range of 1x - 3x.
Then in 2025/6, hype took it to 7x. Now, it's crashing back down to earth, down 40% from its recent highs in July. Reaching the GFC lows of 1x sales would imply a further 75% to fall from here.
Yes, the pre-bubble average of 2x sales is closer, but "the average is just something you pass through on the way to the other extreme."

$CAT reached a free cash flow yield of 1.5% in March 2026.
Long-term averege is 4%, usual range 2% to 6%.
Valuations matter, lession 109392

Caterpillar has slipped to a fresh 30-week relative low.
$CAT’s ByteTrend relative trend (CAPR) score was 5 out of 5 all year until late July. Now it’s 2, and a Weakening Trend (making relative lows with a score above 0).
Only 6 of the 300 largest Western stocks are at such lows.

Some big overnight moves in another crazy earnings season.
Intel $INTC -23%
Reddit $RDDT -18%
Stryker $SYK -12%
And Amazon $AMZN -7%
Plus, $GOOGL was -12% yday
$NOW -26%
And $FTNT -20%.
These are huge moves for huge mkt cap stocks. Size used to reduce vol, now, it reflects crowded names, with investors who all think and react the same.


Chair and CEO at Accenture $ACN just purchased $3.00M of its stock (first-ever purchase). This increased their listed holdings by 33%.
ACN's free cash flow yield briefly went to 16% earlier in 2026, now it's back to 8% after the stock doubled...

What's behind the recent fall in grain prices?
Arguably just noise within the trend.
However, there has been some improvement in global supply prospects and hopes of progress in Russia-Ukraine peace talks. Turkey is leading an effort by grain-importing countries to restore Black Sea trade, and industry estimates suggest Russia could quickly restart about 80% of its Black Sea and Azov grain capacity if a maritime ceasefire takes hold.
Also, the late-summer rally was built on supply fears that haven’t turned out as bad as feared. Connected to this, the Rosario exchange raised Argentina’s 2026/27 wheat forecast.


The last time Nike $NKE traded below 2x sales, it was 2009.
It's ten-year forward CAGR from that point was 20%, as it rose from $10 to $60.
They've been working on the turnaround for years, the bear market is exhausted, there's a group move in consumer stocks, the swoosh is invincible - the strongest brand in apparel, and Jordan's star has never waned.
And it's back to a daily relative trend score of 3/5 on @ByteTrend.

One return ticket to Overvalued, please.
$NKE EV to Sales has completed a round trip from 1.3x sales to 8x sales and back.
What's that old saying again - "buy low, sell high"? Good one.
