

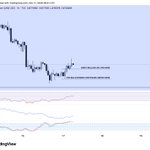




Indeed. Technicals precede narrative.
$NVDA

2
469


Jim Cramer says Nvidia $NVDA is the cheapest it’s been in 10 years, and that now is the time to buy.
2
413

Joe Main retweeted

Another Key macro chart is bearish!
Here's another key macro chart that's flashing a warning sign, and it's one I think every investor should understand.
This is the Nasdaq divided by the S&P 500 (NDX/SPX), and it helps us understand whether investors are taking on more risk or becoming more defensive.
Let me explain why this matters.
The Nasdaq 100 is heavily weighted towards growth and technology companies, while the S&P 500 is spread across a much broader range of sectors.
When this ratio is rising, it means the Nasdaq is outperforming the S&P 500. Investors are generally favouring growth stocks and taking on more risk.
We call this a RISK-ON environment.
When the ratio is falling, the opposite is happening. The Nasdaq is underperforming the broader market, suggesting investors are becoming more cautious and rotating away from growth.
We call this a RISK-OFF environment.
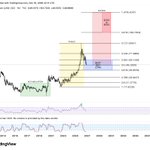
Now look at the chart.
Since the bottom of the 2022 bear market, this ratio has been in a beautiful uptrend for almost FOUR YEARS.
That tells us growth stocks, particularly technology, have been leading the market higher.
But something significant has just happened.
For the FIRST TIME since that uptrend began, we've broken the major trendline AND confirmed a bearish change in weekly market structure.
The last time we saw a similar shift from an uptrend into a downtrend was around the end of 2021, just before the 2022 bear market.
And we all know what happened to growth stocks throughout 2022!
So what does this mean for investors?
It suggests the market is shifting away from rewarding risk-taking and towards rewarding capital preservation.
This is exactly why I've been banging on about playing DEFENCE rather than OFFENCE for weeks.
In this type of environment, I would much rather be looking towards defensive sectors such as Healthcare, Energy, Consumer Staples, precious metals and Utilities than chasing growth stocks simply because they've fallen 15% or 20%.
These defensive sectors have historically tended to hold up better during periods of market uncertainty, although that doesn't mean they can't fall too.
And here's something important.
The Nasdaq doesn't even need to crash for this ratio to keep falling. It simply needs to perform worse than the S&P 500.
That's why relative strength charts like this are so useful. They help us see where money is favouring one part of the market over another, even when the major indices aren't telling the full story.
Does this mean the market can't bounce tomorrow? Of course not!
We're extremely oversold in parts of the market, and I wouldn't be surprised to see a decent bounce.
But a bounce doesn't automatically mean the bigger trend has changed.
Until this ratio starts rebuilding a bullish market structure, the evidence continues to favour a more defensive approach.
Remember, the goal isn't to buy every dip.
It's to protect your capital when risk is increasing, so you're in a position to take advantage of opportunities when the data improves.
For now, I'm still playing defence.
Enter on data. Exit on data. Not emotion. When everything aligns it's not coincidence.
Mastering the Markets Pty Ltd (CAR 001309433) is a Corporate Authorised Representative of ShareX Pty Ltd (AFSL 519872). General education only, not personal financial advice. Consider your own circumstances and seek independent advice before making financial decisions.


I respect people who have high conviction on their investments.
But $200 $SILVER in 54 days from now is not a thing.
A 1% chance of a black swan event we can't see coming, pushing it there in that time? Sure.
Normal market moves? No.

