





Joe Main retweeted

Another Key macro chart is bearish!
Here's another key macro chart that's flashing a warning sign, and it's one I think every investor should understand.
This is the Nasdaq divided by the S&P 500 (NDX/SPX), and it helps us understand whether investors are taking on more risk or becoming more defensive.
Let me explain why this matters.
The Nasdaq 100 is heavily weighted towards growth and technology companies, while the S&P 500 is spread across a much broader range of sectors.
When this ratio is rising, it means the Nasdaq is outperforming the S&P 500. Investors are generally favouring growth stocks and taking on more risk.
We call this a RISK-ON environment.
When the ratio is falling, the opposite is happening. The Nasdaq is underperforming the broader market, suggesting investors are becoming more cautious and rotating away from growth.
We call this a RISK-OFF environment.
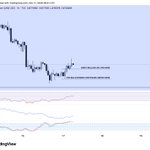
Now look at the chart.
Since the bottom of the 2022 bear market, this ratio has been in a beautiful uptrend for almost FOUR YEARS.
That tells us growth stocks, particularly technology, have been leading the market higher.
But something significant has just happened.
For the FIRST TIME since that uptrend began, we've broken the major trendline AND confirmed a bearish change in weekly market structure.
The last time we saw a similar shift from an uptrend into a downtrend was around the end of 2021, just before the 2022 bear market.
And we all know what happened to growth stocks throughout 2022!
So what does this mean for investors?
It suggests the market is shifting away from rewarding risk-taking and towards rewarding capital preservation.
This is exactly why I've been banging on about playing DEFENCE rather than OFFENCE for weeks.
In this type of environment, I would much rather be looking towards defensive sectors such as Healthcare, Energy, Consumer Staples, precious metals and Utilities than chasing growth stocks simply because they've fallen 15% or 20%.
These defensive sectors have historically tended to hold up better during periods of market uncertainty, although that doesn't mean they can't fall too.
And here's something important.
The Nasdaq doesn't even need to crash for this ratio to keep falling. It simply needs to perform worse than the S&P 500.
That's why relative strength charts like this are so useful. They help us see where money is favouring one part of the market over another, even when the major indices aren't telling the full story.
Does this mean the market can't bounce tomorrow? Of course not!
We're extremely oversold in parts of the market, and I wouldn't be surprised to see a decent bounce.
But a bounce doesn't automatically mean the bigger trend has changed.
Until this ratio starts rebuilding a bullish market structure, the evidence continues to favour a more defensive approach.
Remember, the goal isn't to buy every dip.
It's to protect your capital when risk is increasing, so you're in a position to take advantage of opportunities when the data improves.
For now, I'm still playing defence.
Enter on data. Exit on data. Not emotion. When everything aligns it's not coincidence.
Mastering the Markets Pty Ltd (CAR 001309433) is a Corporate Authorised Representative of ShareX Pty Ltd (AFSL 519872). General education only, not personal financial advice. Consider your own circumstances and seek independent advice before making financial decisions.


Joe Main retweeted
SILVER HAS CRASHED 60%. BUT HAVE WE SEEN THIS BEFORE?
At the end of 2025, I wrote an article explaining why I believed gold and silver were heading into its final run before a deep correction. couriermail.com.au/business/…
How did I come to that conclusion?
By studying the chart's personality. History doesn't always repeat, but it often gives us clues.
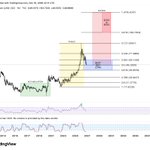
Look at the chart below.
Historically, silver has shown seasonal weakness from around February-April through to October/November. Now, everyone's calling this the worst silver crash in history. But here's what's interesting. During the previous major Wave 4 correction in 2008, silver fell around 60% between March and November.
Fast forward to 2026.
Silver peaked around February and has now corrected approximately 59% into November. Almost the exact same correction. Almost the exact same seasonal window. But what fascinates me most isn't the price. It's the psychology.
For years, I'd been posting bullish analysis on gold and silver. Then, at the end of January, I warned that we were approaching the top of the wave and a major correction was coming.
The abuse was incredible.
"Don't you understand the fundamentals?"
Mate, the fundamentals you're explaining are the exact fundamentals Tung and I were discussing on YouTube back in early 2024! youtu.be/d1BDXiKPk7U
They're not new. That's WHY we were buying silver in the $20s, long before it went on to rally around 6x. You're buying a story today that we understood years ago. And now look what's happened. Sentiment has completely flipped the other way. The same people who couldn't imagine silver falling are now convinced it's all over.
This is how market cycles work. Accumulation, public participation, excess, correction - wipe out the excess. Then the cycle starts again.
And right now, there's a LOT of confluence suggesting another major market low could be approaching.
Look at what's lining up.
Gold-to-Dow ratio is back at key support.
Gold-to-silver ratio is back at key resistance and very overbought, with the potential to turn lower.
Commodities are deeply oversold and approaching important technical levels.
Seasonality is lining up with previous major lows.
Market sentiment has swung heavily towards fear and bearishness.
When you have this many independent pieces of evidence pointing towards the same outcome, you pay attention. Does that mean the bottom is definitely in? Of course not. But it tells me the probabilities of a major reversal are increasing. As I told everyone last night, I'm NOT blindly buying. I'm watching closely for the technical evidence of a major reversal. The price has entered an area that interests me. Now I need the market to confirm it.
The eagle has spotted its prey. Now it's time to zoom in, wait for the right moment, and strike.
Patience. Preparation. Execution.

Joe Main retweeted

I’ve got some premium air to sell you if you believe $200 silver is coming within 6 months.

David Hunter sees gold reaching $7,000 an ounce and silver climbing to $200 over the next three to six months. He believes precious metals likely carved out a major low after recent selling washed out bullish sentiment, pointing to silver's prior surge from the $40s to $122 in less than three months as precedent. In his view, falling bond yields will push the U.S. dollar down toward 82 to 84, fueling the move. He expects this next rally to deliver higher highs and an even steeper advance than the last.


Joe Main retweeted

Nice looking #Silver Chart 🍹😎
PS: It's all about perspective & conviction 📈✅
#BuyRightSitTight
#PreciousMetalsSuperCycle 🔃
🤘🦅


Joe Main retweeted

1774: they blew tobacco smoke up drowning victims' backsides to revive them, and the kits hung along the Thames like lifebuoys.
1863: they sold cocaine wine as a daily tonic, and a pope pinned a gold medal on it.
1898: they sold heroin as a cough medicine, and spooned it into coughing children.
1918: they sold radium water as a health drink, and the millionaire who drank 1,400 bottles was buried in a lead-lined coffin with most of his jaw gone.
1921: they put lead in petrol, and Britain kept it in the pumps until 2000.
1930s: they X-rayed children's feet in shoe shops, and kids queued to watch their toes wiggle on the screen.
1940s: they rubbed mercury teething powder into babies' gums, and about 1 in 500 of those babies was poisoned.
1946: they sold cigarettes on the line that more doctors smoked their brand, and put a man in a white coat on the advert.
1949: they gave the lobotomy a Nobel Prize, and doctors went in through the eye socket with an ice pick.
1952: they sold a cigarette filter made of asbestos as the greatest health protection in smoking history, and smokers drew it into their lungs with every puff.
1957: they sold thalidomide to pregnant women for morning sickness, and around 10,000 babies were born with missing or shortened limbs.
1960s: they sold margarine as the heart-healthy fat, and spread trans fat on a generation's toast.
1996: they sold OxyContin as barely addictive, and started an overdose epidemic.
1999: they sold Vioxx for sore joints, and pulled it five years later after tens of thousands of heart attacks.
2026: they're selling seed oil as the heart-healthy fat, and it's in almost every packet in your kitchen.
Every one of these came with an expert's blessing and the same total certainty.
The people telling you which fat to fear today sit in the same chairs as the ones who put radium in the water and a doctor on the cigarette packet, and they're every bit as sure.
"The experts recommend it" has the longest body count in medicine.

Joe Main retweeted
If you didn't like Digger you are weak and won't survive the Winter nitter.cf/Brizksie/status/211261…

Joe Main retweeted

For those of you who aren’t students of history…this is precisely what a communist revolution looks like.
Joe Main retweeted
WHAT HAPPENED TO PROPERTY DURING THE GFC?
Most people know US property prices crashed during the Global Financial Crisis, but very few understand what actually happened beneath the surface.
When you buy a property, you're buying two things. The land and the dwelling sitting on it.
What's fascinating is how the relationship between these two changes throughout major property cycles. Research published by the Federal Reserve Bank of St. Louis examined US residential land and building values from 1975 to 2012.
In 1998, land accounted for approximately 30% of total residential property values.
But by late 2005, that ratio had climbed to a staggering 48.5%!
Almost HALF the value of residential property was now attributed to the land.
So what happened when the property cycle reversed?
Between 2006 and 2012:
🏡 Land values COLLAPSED approximately 69%
🏗️ Aggregate building values actually ROSE approximately 3%
📉 Total residential property values fell approximately 31%
Following the crash, the land-to-property value ratio had fallen all the way back to 21.3%.
From almost 50% to just over 20%!
The buildings themselves hadn't experienced the same collapse in aggregate value. It was the land that absorbed most of the correction.
And this is why understanding property cycles is so important. Did it crash or did it just return to the historical average?
Land can become extremely expensive during a boom, particularly when cheap credit, speculation and strong buyer demand push valuations higher.
But when those conditions reverse, land values can experience enormous corrections.
It raises a very interesting question.
What proportion of Australian property values today is actually land, and how does that compare with historical levels?
Because understanding what happened in previous property cycles might tell us far more than simply looking at house prices.
I'll share tomorrow.


Joe Main retweeted

DIGGER is a fucking masterpiece.
See it asap. Do no research. Best movie I’ve seen in a while.

Joe Main retweeted

Should the Aus government be allowed to censor anything it believes “may cause serious harm” and operate unlimited fake social media accounts?
3%Yes
97%No
9,697 votes • Final results


